NOIDA (CoinChapter.com) — Bitcoin price has seen a sharp correction, with the latest downtrend pushing the token below $79,000 for the first time since Nov. 2024. The plunge sparked fresh debate over whether the Bitcoin top is in. After touching highs above $109,000 in early 2025, BTC price has since plunged over 28%. This sudden crash has rattled the market, with liquidations soaring, and investors are questioning whether the Bitcoin top is in or not.
Several factors are fueling this downturn. The Federal Reserve’s latest signals suggest that interest rate cuts may not come as soon as markets had expected. Stubborn inflation and a strong labor market are giving Fed officials room to delay rate cuts, dampening risk-on assets like BTC. Liquidity could tighten further if the Fed maintains its hawkish stance, adding more selling pressure on the token.
Beyond Fed policy, geopolitical and economic risks are growing. Donald Trump’s proposed tariffs on China and Mexico have already caused ripples in financial markets. These tariffs could increase economic uncertainty if implemented, leading investors to flee speculative assets.
Meanwhile, Bitcoin inflows to exchanges have risen sharply, signaling that large holders may be looking to offload BTC. If this trend continues, selling pressure could remain high in the short term.
The big question now: Is this a temporary pullback, or has BTC already reached its cycle top?
What The Charts Say
The latest on-chain charts reveal Bitcoin at a crucial turning point. A closer look at key indicators sheds light on whether this correction is temporary or signals the start of a deeper downturn.
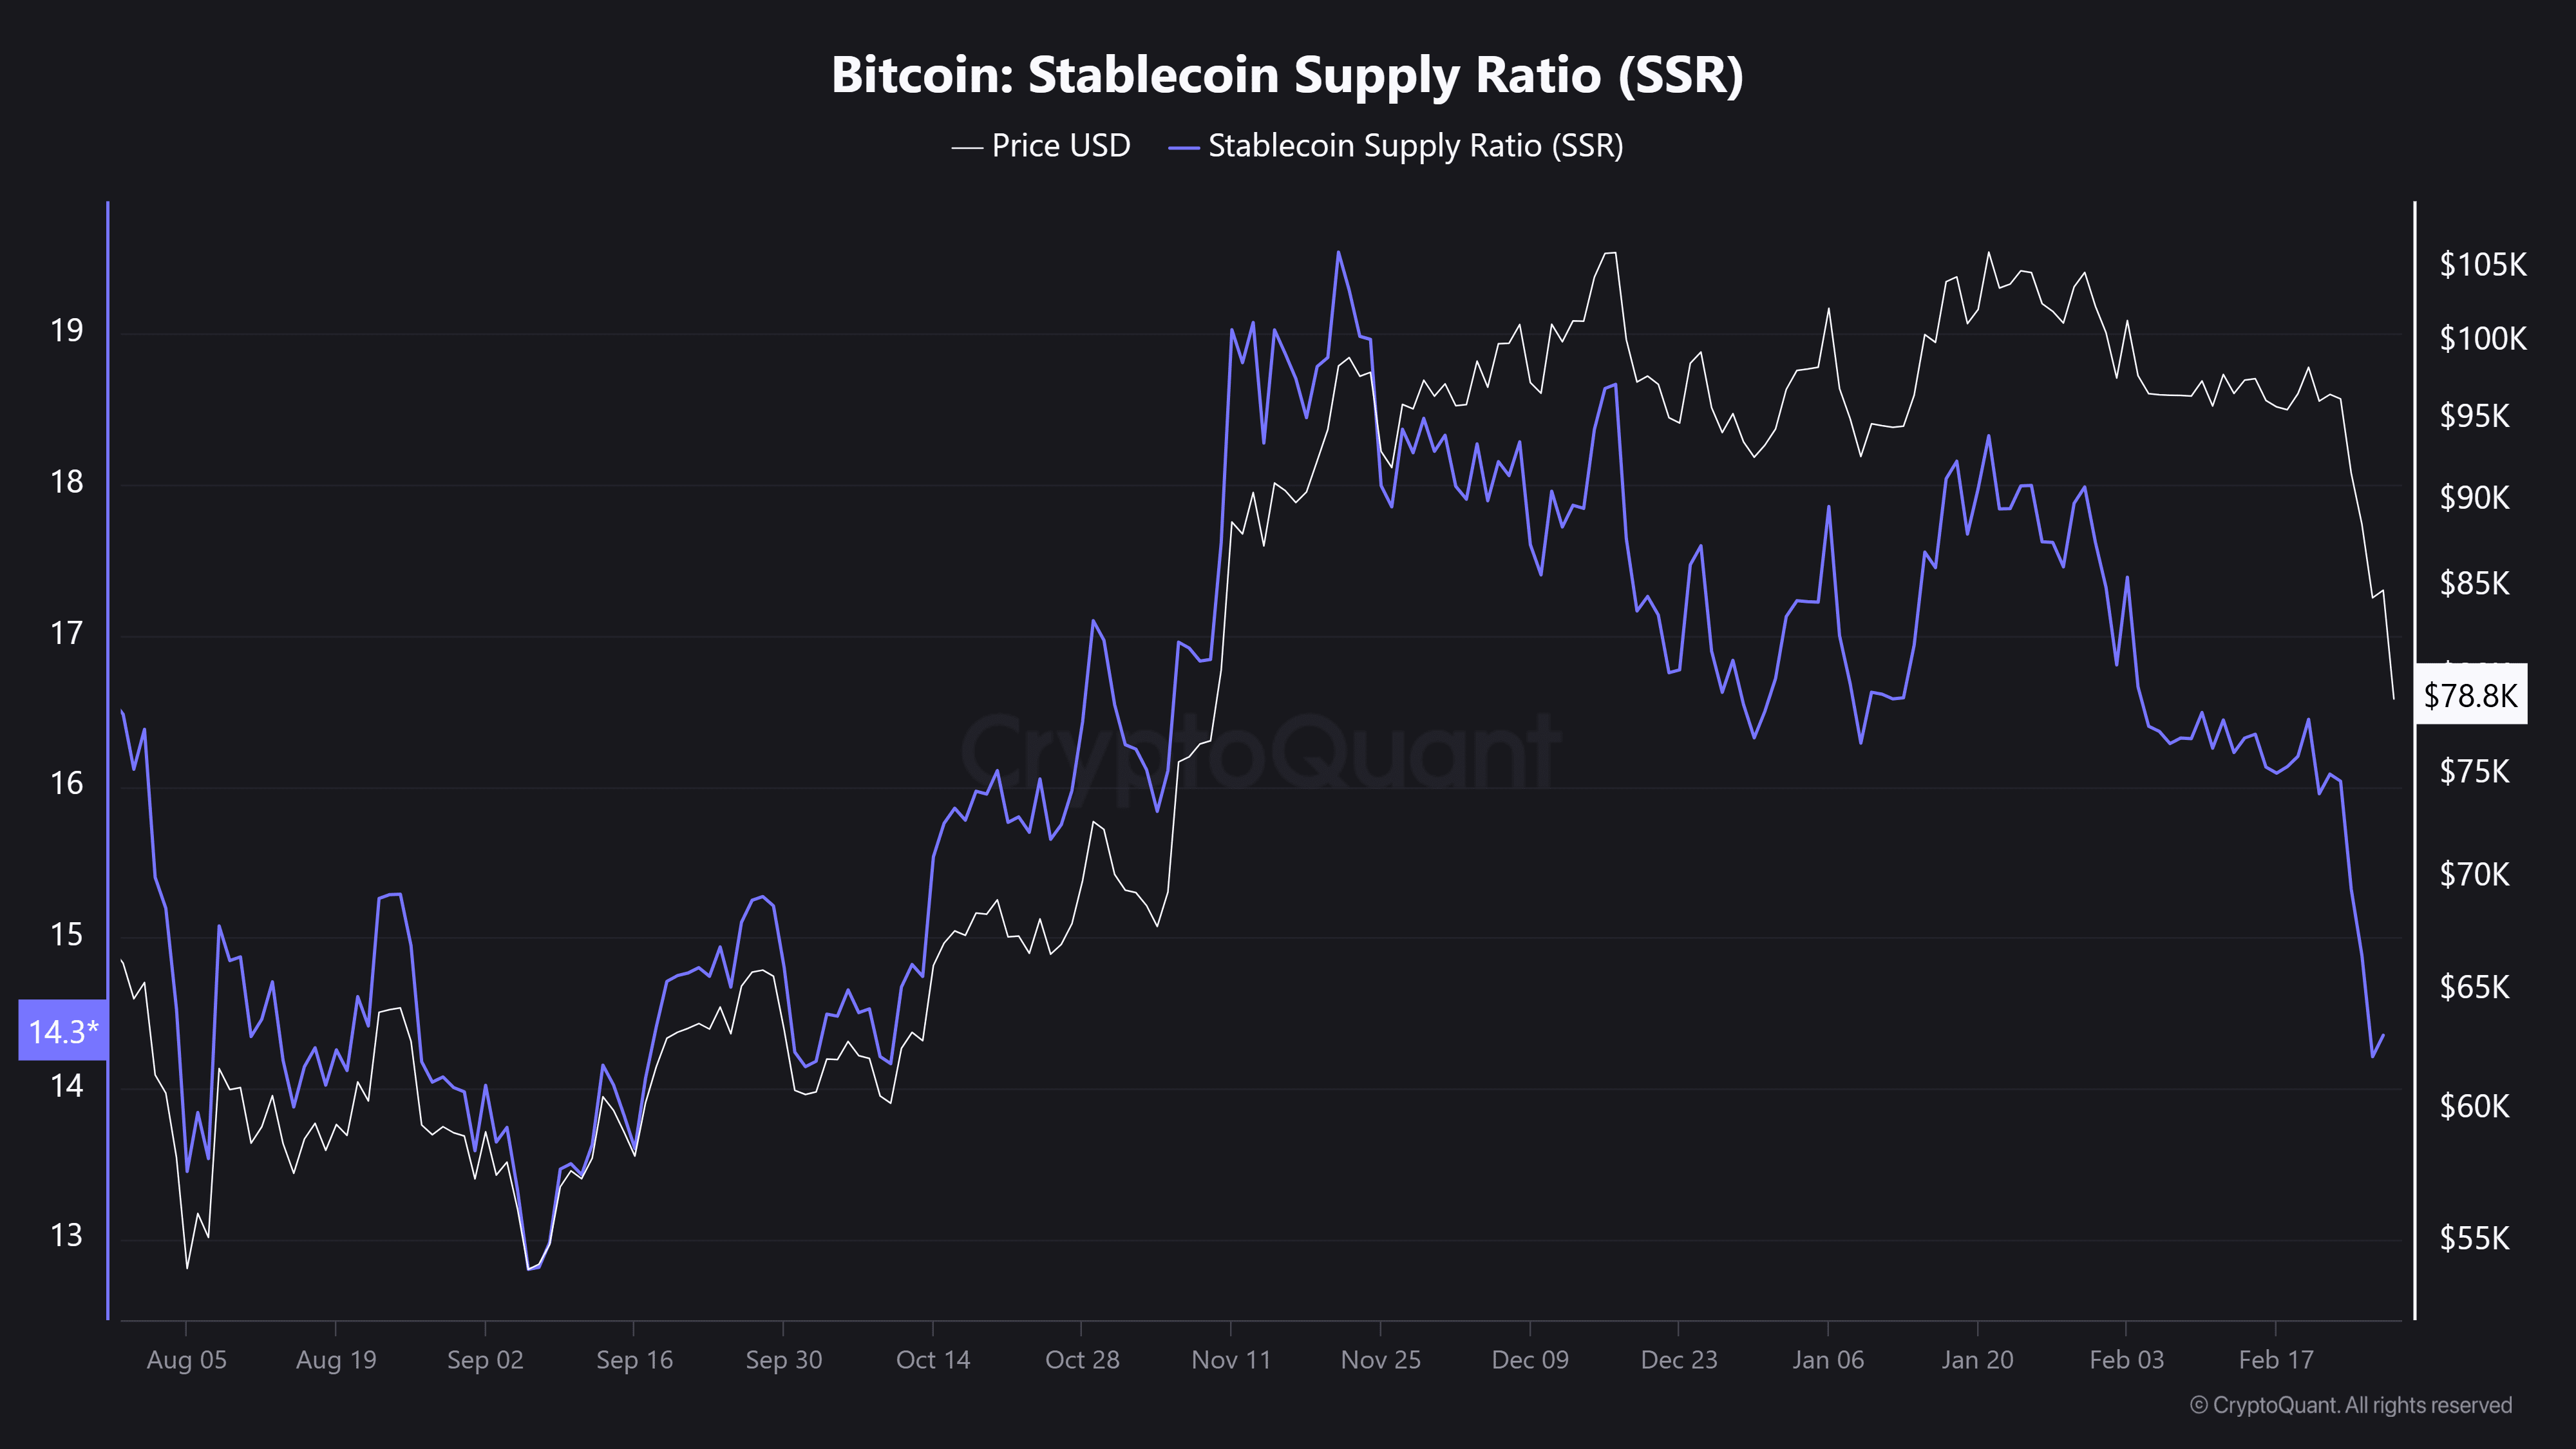
Bitcoin’s Stablecoin Supply Ratio (SSR) has dropped sharply, showing that stablecoins are gaining relative strength against BTC. The SSR measures Bitcoin’s market cap relative to stablecoins and helps gauge whether there’s sufficient liquidity for further price appreciation. A falling SSR indicates that more capital is parked in stablecoins rather than flowing into Bitcoin.
BTC Stablecoin supply ratio. Source: TradingviewThe pattern suggests investors are de-risking, typically when a market cycle nears its top. If Bitcoin were still in a strong uptrend, the SSR would likely remain stable or rise as liquidity continues flowing into BTC. Instead, the decline points to a potential distribution phase, reinforcing concerns that the Bitcoin top is in.
Bitcoin’s MVRV Z-Score, a valuation metric that compares BTC’s market price to its realized price, has also turned lower. When the MVRV Z-Score reaches extreme highs, Bitcoin is historically overvalued, signaling a potential top.
BTC MVRV-z score. Source: GlassnodeWhile the indicator has not yet hit peak cycle levels, the sharp downward movement suggests that Bitcoin is no longer in extreme euphoria. Similar patterns have been observed in past cycles before major corrections. This supports the argument that BTC is entering a cooling-off phase rather than gearing up for another explosive leg higher.
Bitcoin dominance, which measures BTC’s share of the total crypto market cap, is another indicator flashing warning signs. The latest dominance reading shows BTC rejected at 60.7%, a level that previously marked late-stage Bitcoin cycles. When BTC dominance tops and begins to fall, it often signals the start of capital rotation into altcoins.
Bitcoin dominance and the altcoin market cap. Source: TradingviewThis phase has historically preceded the final phase of the crypto bull market before an eventual bear cycle. If dominance continues to decline, it strengthens the case that the Bitcoin top is in and that the market is entering a riskier phase where altcoins take the lead before a broader market downturn.
The final red flag comes from Bitcoin’s Exchange Netflow, which tracks BTC inflows and outflows across exchanges. Over the past few weeks, BTC inflows to exchanges have increased significantly, a bearish sign. Rising inflows suggest that large holders are preparing to sell, as they move Bitcoin from private wallets to exchanges.
Bitcoin exchange total netflow.Historically, similar inflow spikes have preceded major sell-offs, as did during the 2021 peak. If this trend continues, Bitcoin could face further downside pressure, adding more weight to the Bitcoin top is in thesis.
On-chain data paints a clear picture: rising exchange inflows, a declining SSR, and Bitcoin dominance struggling to hold recent highs all suggest a potential local top. While the MVRV Z-Score indicates that Bitcoin is not in a full-blown bubble, momentum is fading. The market could enter a prolonged correction phase if Bitcoin fails to regain strength in the coming weeks.
Market Sentiment On Whether Bitcoin Top Is In Remains Divided
Despite growing concerns that the Bitcoin top is in, market sentiment remains split. While some analysts see the recent crash as a warning, others argue that Bitcoin still has more upsides.
Traders are claiming that Bitcoin dominance has peaked and that Altcoin season is coming.Merlijn de Smit believes Bitcoin dominance has peaked, signaling a possible cycle shift. Historically, when BTC dominance tops out, it often leads to capital rotation into altcoins, which precedes the broader market peak. Smit’s view aligns with recent market trends, where BTC has struggled to maintain its dominance, and traders are beginning to allocate more capital into alternative assets.
On the other hand, traders like Ben Lilly and Arthur Hayes maintain that Bitcoin has not yet reached its final peak. Hayes hinted that BTC price could drop further over the weekend, reaching below $80,000 but then the prime crypto will start consolidating.
Arthur Hayes warns of another Bitcoin drop below $80K.Historically, Bitcoin’s most explosive moves have come 12 to 18 months post-halving, which suggests that the final peak may not arrive until late 2025 or early 2026. If this pattern holds, the latest drop could be a mid-cycle correction rather than a definitive top.
Meanwhile, BTC price remains above its 2021 all-time high of $69,000, which some traders see as a bullish indicator.
BTC remains above its 2021 top, despite its recent drop.Holding above this key level suggests structural strength, despite the recent sell-off. However, the broader macro risks and increasing selling pressure on-chain suggest that Bitcoin’s ability to sustain higher prices could be at risk. The battle between bulls and bears is heating up, with no clear winner yet.
The coming weeks will determine which side is right. If BTC dominance continues to drop while stablecoin reserves remain high, altcoins will likely take over. But if institutional accumulation resumes and BTC outflows increase, Bitcoin could reclaim its uptrend. For now, traders remain cautious, watching key technical and on-chain levels closely.
The evidence is mixed, but the probability of a local top is rising. On-chain signals, including high exchange inflows, weakening Bitcoin dominance, and a declining SSR, all suggest that the token’s momentum is slowing. If Bitcoin dominance continues to fall and stablecoin liquidity remains on the sidelines, the market could shift towards altcoins, reinforcing the Bitcoin top is in narrative. However, if institutional buying resumes and exchange outflows increase, Bitcoin could stage a strong recovery.
The post Bitcoin’s Collapse Below $79K Sparks Chaos: Is the Bitcoin Top In? appeared first on Coinchapter.
%%featured_image%%

